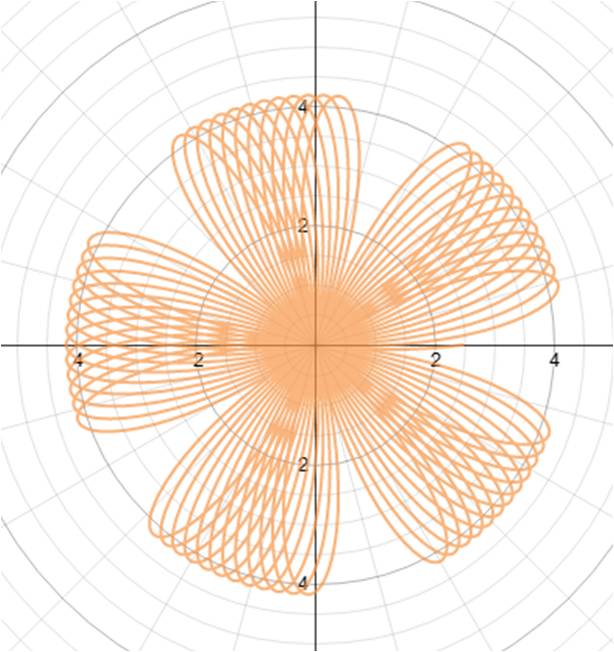
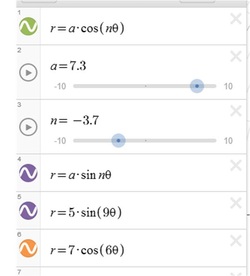
| My first one is a polar equation which is the most recent thing we learned, in this picture I included both the equations and graph. Both my equations were based off the equation (r=a x cos (n x theta)). I then used sliders to change the shape and size. | 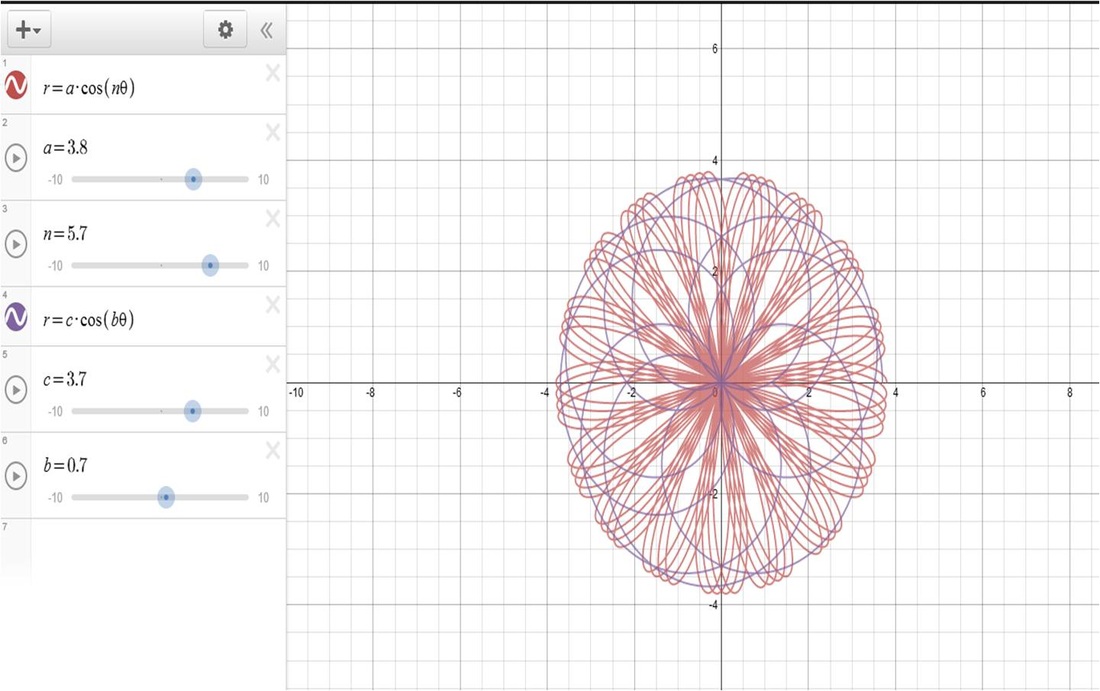 |
| My second desmos graph is of trigonometric ratios. I just did a simple y=sinx and y=cosx. But I added coefficients then I added sliders so those. I made it so they were opposite graphs. To change these graphs up a little more I did them to the 7th power. I like the way it looks. I'm not a hundred percent sure why it looks like that. | 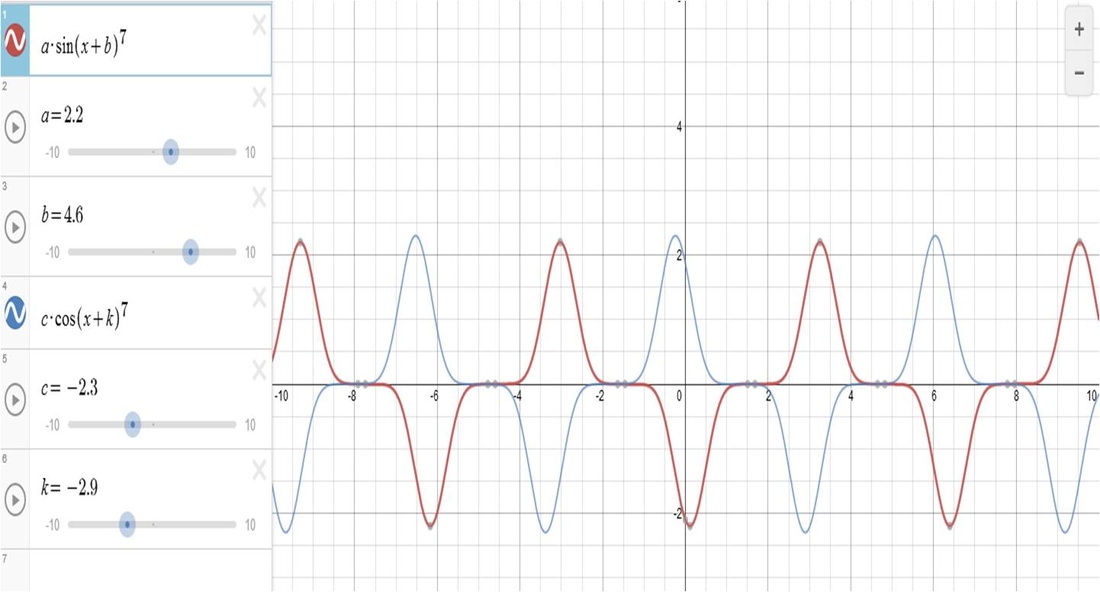 |
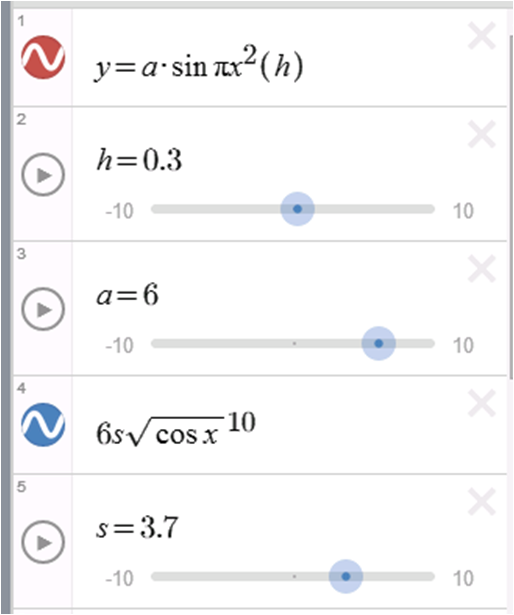
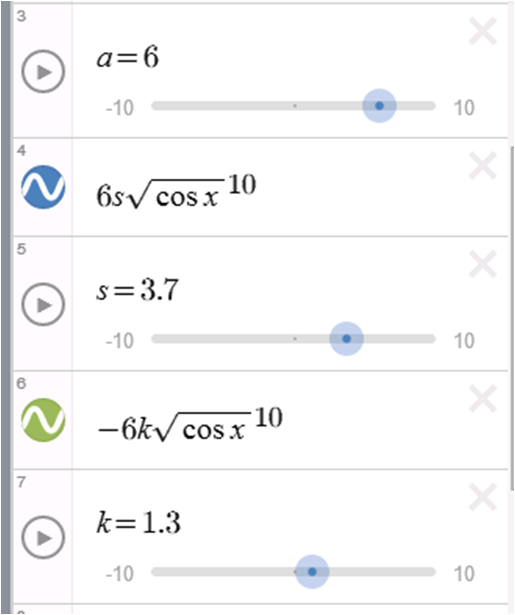
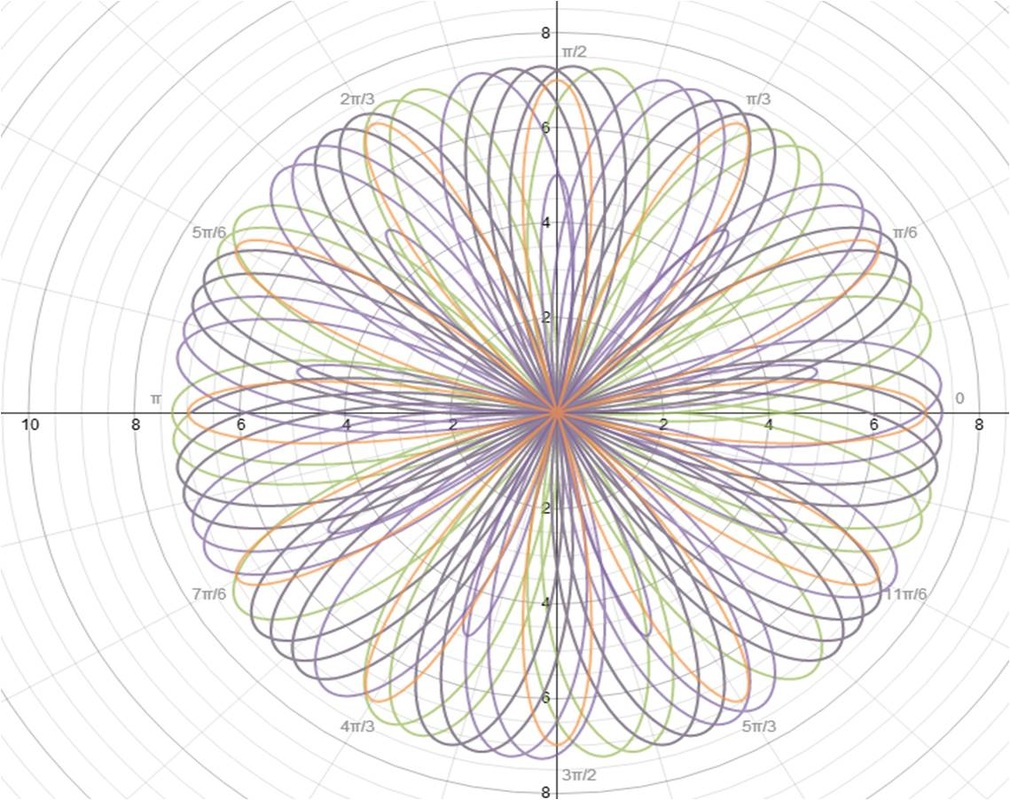
| In this one I did more complex trigonometric ratios and put it in gifsmos. The equations are in the picture underneath. I learned through this that trigonometric graphs can be way more complex than I thought and fun to graph just by adding sliders and moving things around. |  |
My graphs then and now are pretty different. I learned that you can add sliders and put square roots and powers any where you please. This caused for more creativity and more thinking. More thinking because you want to figure out why adding these things cause such a big change or maybe no change at all. Gifsmos also adds to the effect of creativity. It's a nice tool when you want your graphs to look cool or show how the sliders at different numbers can really change the position and what not of the graph. Polar equations didn't change much for me because who doesn't love flowers all the time? :-)
 |  |
 RSS Feed