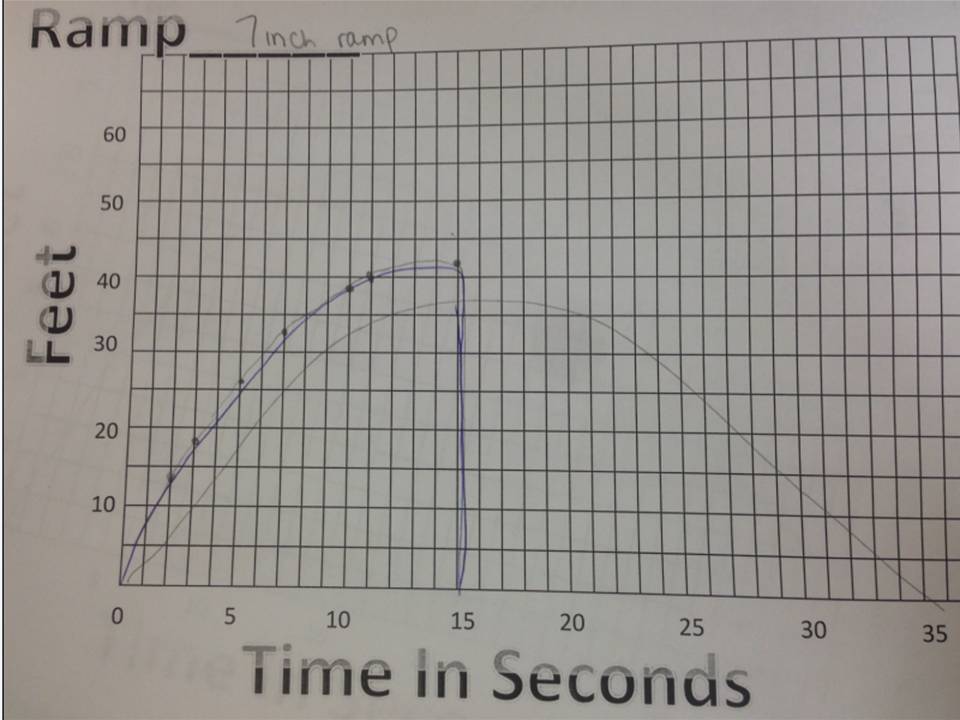
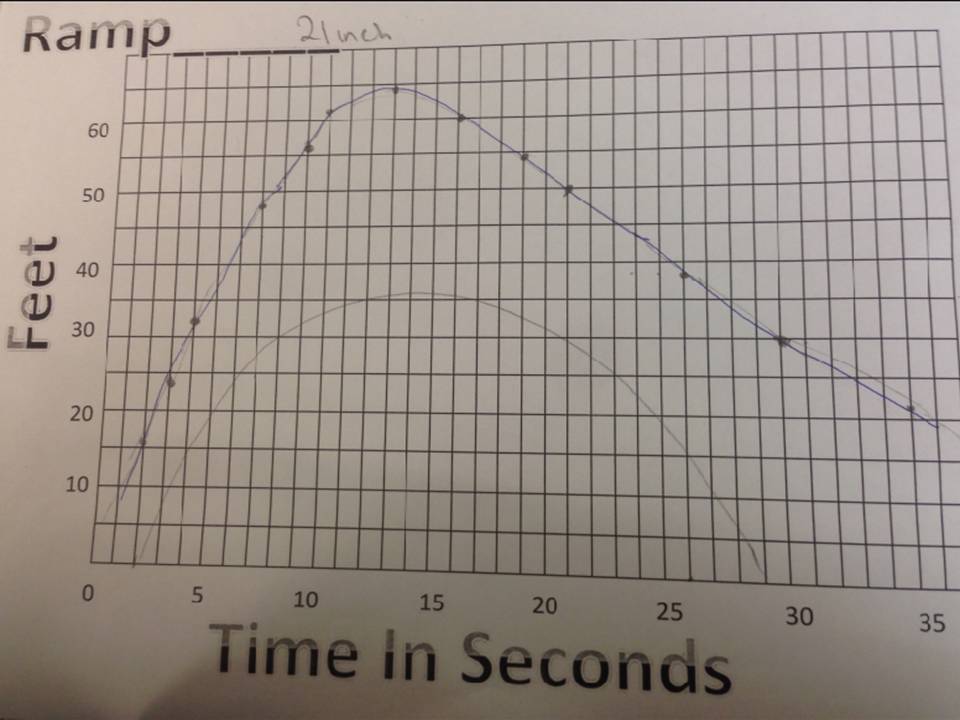
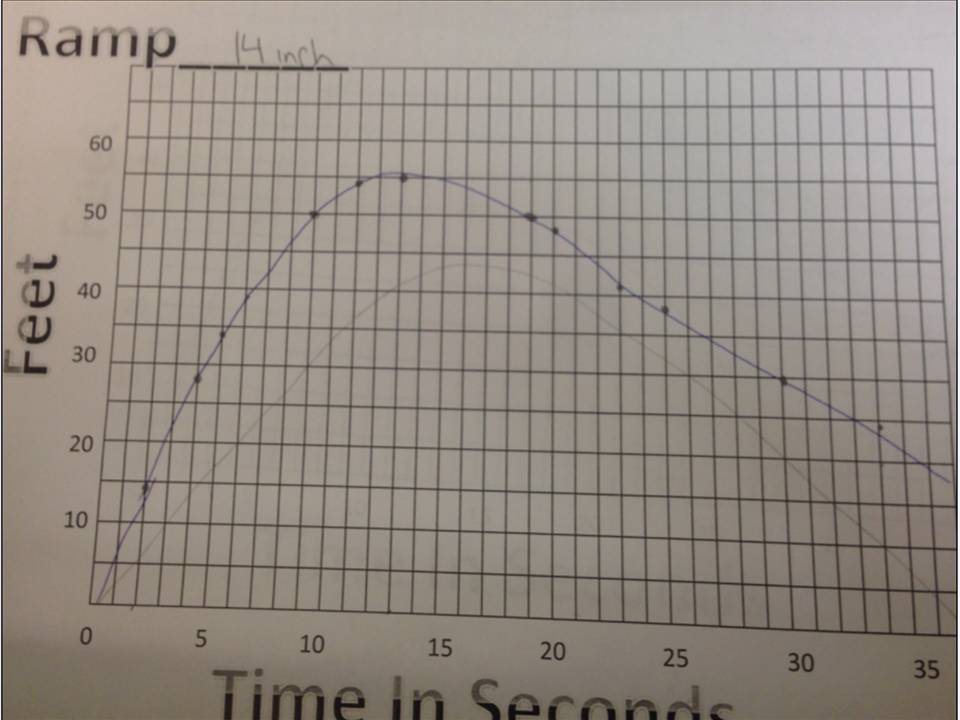
1. My first prediction graph was not close to what the actual was, it was much smaller than the real answer. My second one for the 14 inch ramp was closer to the actual than what I did for the 21 inch ramp, this was also a little bit smaller than the actual. My last prediction, for the 7 inch ramp, was not very close, this was because the skateboard never went backwards it just stopped. My prediction graphs were just honest guesses, I didn't really use anything to help me.
2. The zeroes of the graph represent the top of the ramp before you let go and the cut off time of when the skateboard stopped moving.
3. The first two cut off around the same time but the 7 inch ramp ended much quicker than the others. They all started at the same point. The 21 inch ramp definitely had the highest maximum followed by the 14 inch, then 7 inch. This is obviously true because the 21 inch ramp gives the skateboard more time to gain speed than the smaller two. The minimums of the first two are pretty similar but the 7 inch definitely cut off much faster.
4. When the graphs rise quickly it means the skateboard is gaining speed very quickly. So it would rise when the skateboard is going fast. The graph is falling the fastest when the skateboard goes backwards. This is because the skateboard has last its speed and begins to decline fast.
5.
 RSS Feed